Metrics
Install helm chart
For settings see: Helm Chart Values
Prometheus-community stack
- Add and update the prometheus-community repo
helm repo add prometheus-community https://prometheus-community.github.io/helm-charts && \ helm repo update - Install / Deploy it with helm
# For new install
helm install prometheus-stack --version 72.5.3 -f prometheus-values.yaml prometheus-community/kube-prometheus-stack
# Or e.g. after updating values helm upgrade prometheus-stack --version 72.5.3 -f prometheus-values.yaml prometheus-community/kube-prometheus-stack
Ingresses
- Alertmanager (alert-manager.example.com)
cat alert-manager-ingress.yaml | envsubst | kubectl apply -f - - Prometheus (prometheus.example.com)
cat prometheus-ingress.yaml | envsubst | kubectl apply -f - - Grafana (grafana.example.com)
cat grafana-ingress.yaml | envsubst | kubectl apply -f -
Traefik service monitor
cat traefik-service-monitor.yaml | envsubst | kubectl apply -f -
Traefik dashboard service
cat traefik-dashboard-service.yaml | envsubst | kubectl apply -f -
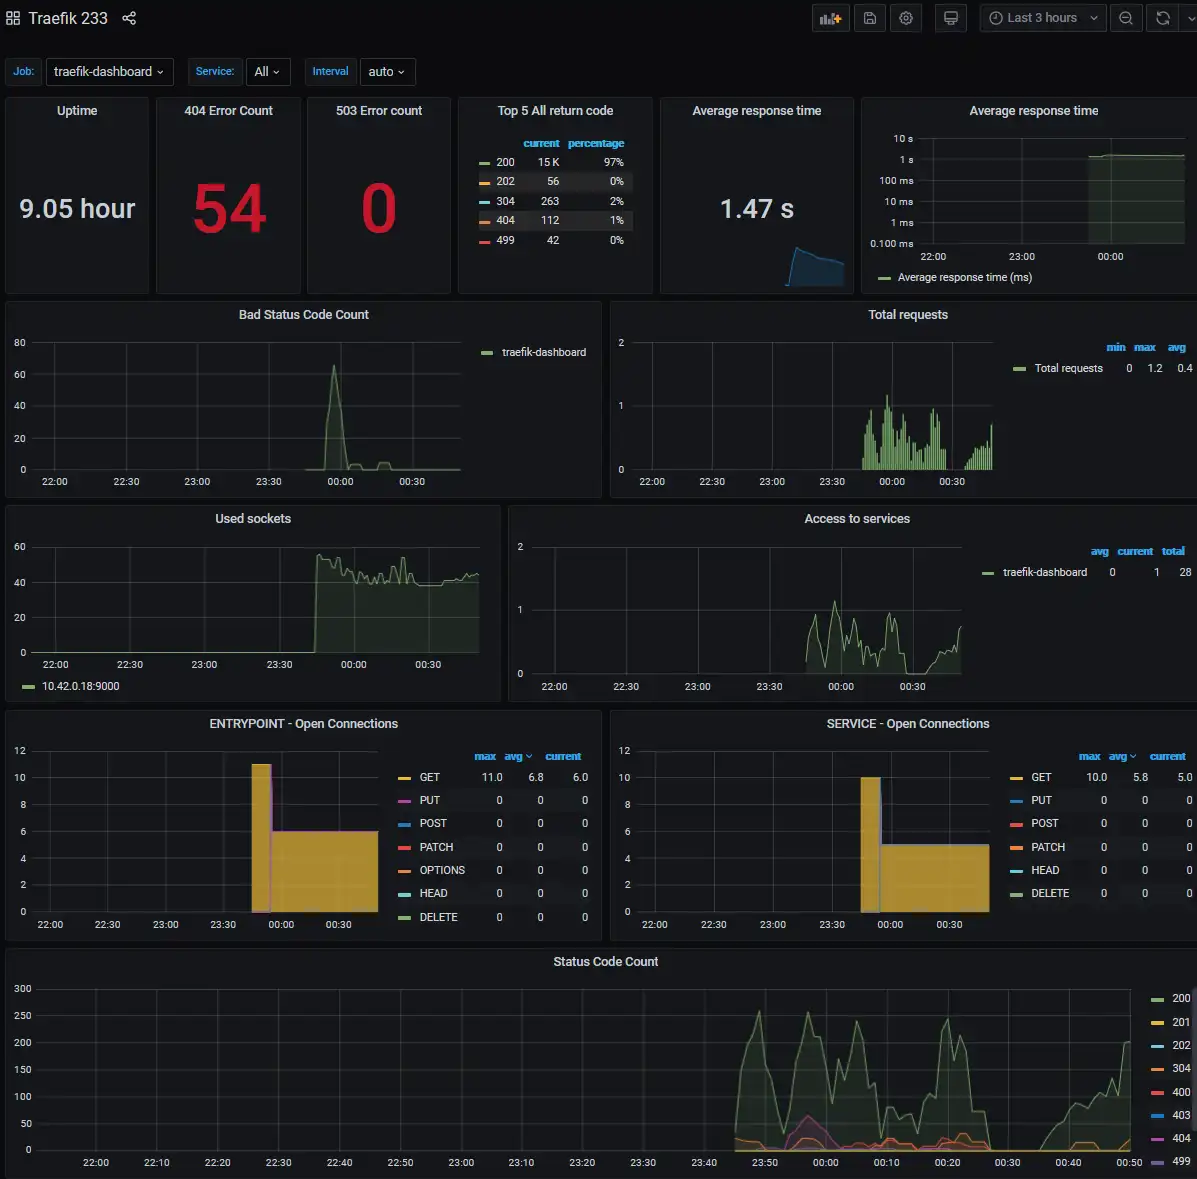
Traefik grafana dashboard
kubectl apply -f traefik-dashboard.yaml
Done
- Check alert-manager, prometheus or grafana to see how it looks http://grafana.example.com